The Page Drilldown Dashboard is a built-in ActionKit report that gives detailed stats on action takers, new subscribers, donations, and and related mailings for a given page.
Like other dashboards, it pulls information from multiple reports and displays them all on a single page, and it’s great for getting an all-in-one overview of how a page has performed.
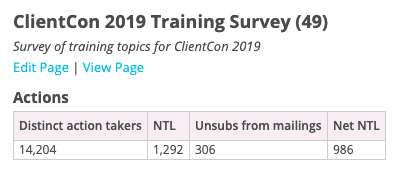
For actions, you can see how many unique action takers you’ve received, how many new-to-list users joined on this page, and your net new-to-list count (minus unsubscribes) to see if you grew your list.
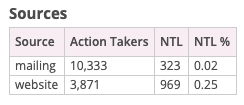
You can also see a summary of the sources of actions on this page, including how many new-to-list users you had from each.
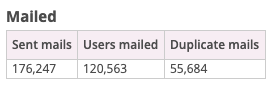
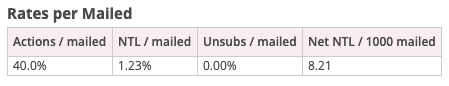
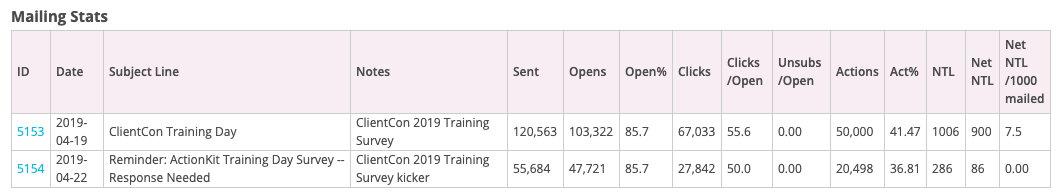
For related mailings, you can see how many users received a mailing that led to actions on this page, including the number of mailings sent to people who had already received an ask to take action on this page.
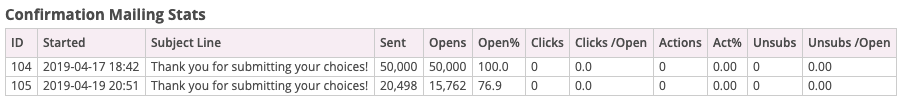
Each related mailing is also shown, with a performance breakdown for opens, clicks, actions, and unsubscribes. Confirmation mailing performance is shown if you’ve set one up for this page, and if you have a notification mailing set up, you’ll see performance for that too.
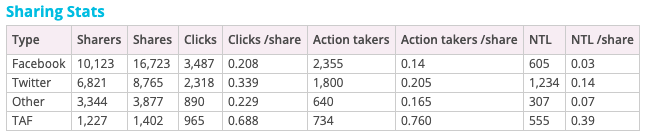
Finally, there’s a section for shares so you can see the number of users who shared this page, plus a breakdown of shares by platform and clicks, actions, and new-to-list by shares.
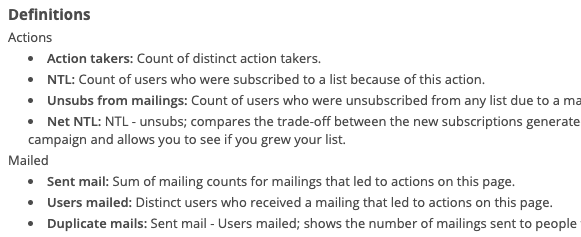
If you aren’t sure what the Net NTL refers to, for instance — don’t worry! All of the terms are defined below the fold:
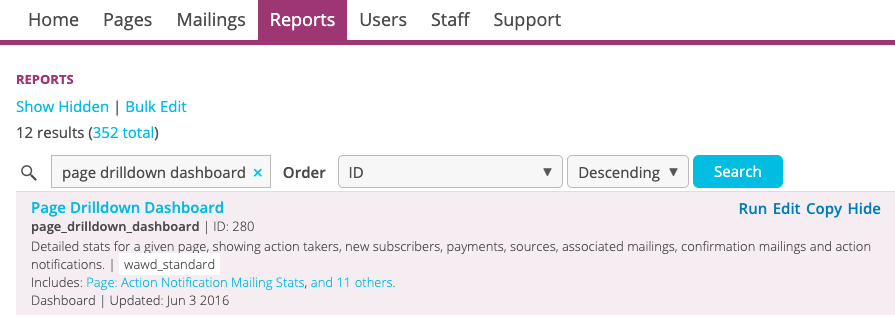
That’s a lot of information packed into one dashboard — give it a try! From the Reports tab, go to Browse All and search for Page Drilldown Dashboard:
I think the Page Drilldown Dashboard is really useful not only as a dashboard report, but also as an example of how to build out a dashboard report that’s descriptive and clear. Try it yourself!
Interested in scheduling a demo with ActionKit? Let us know!